Braeden Shrewsberry
New here?How to read this page
▶
How to read this page
Team tables split by side of the ball, and the Side control hides the half you are not reading. The roster is everyone who played that season, so a transfer appears under the program he actually played for rather than the one he is at now. There is no game-type control because the tables hold regular-season games only. A dash means no number for that cell, or a zero in a roster column that counts.
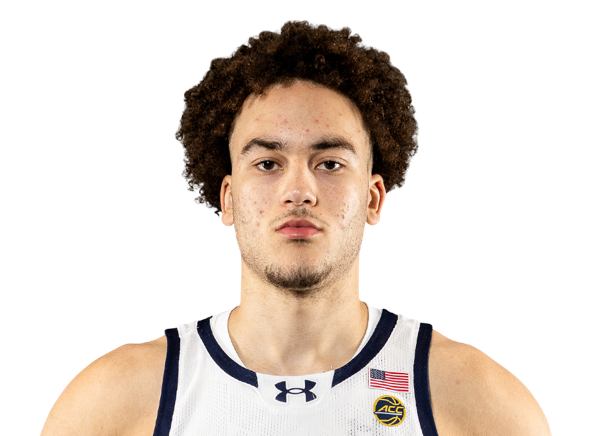
Braeden Shrewsberry
 G2026-27
Worth knowingBraeden Shrewsberry comes in 7th of 59 players in assists, at 3 per game.
94th beats 94% of the Players; 1 is the best of however many the row says. Higher is always better, whichever way the stat runs. Red to green by where the placing sits. A stat with no better end is left unpainted.
Cardsall 7 shown▶
Playing Time▶
ScoringOffense▶
ShootingOffense▶
Shot ProfileOffense▶
PlaymakingOffense▶
Rebounding▶
ReboundingOffense▶
ReboundingDefense▶
DefenseDefense▶
Game log1 games
| Date | Opp | MIN | PTS | FGM | FGA | 3PM | 3PA | FT | REB | AST | STL | BLK | TOV | PF |
|---|---|---|---|---|---|---|---|---|---|---|---|---|---|---|
| Nov 1, 2026 | @ VILL#1 | 36 | 15 | 6 | 14 | 3 | 8 | 0-2 | 6 | 3 | 1 | 0 | 0 | 2 |
| Season | GP | MIN | PTS | REB | AST | FG% | 3P% | TS% | BPM |
|---|---|---|---|---|---|---|---|---|---|
| 2026-27 | 1 | 36 | 15 | 6 | 3 | 42.9% | 37.5% | 50.4% | — |
| 2025-26 | 31 | 32.7 | 11.9 | 3.1 | 1.9 | 39% | 40.2% | 55.8% | 4.2 |
| 2024-25 | 26 | 34.6 | 14 | 3 | 1.6 | 41.3% | 36.9% | 55.1% | 4.1 |
| 2023-24 | 33 | 28.2 | 10.2 | 2.5 | 0.9 | 39.8% | 37.1% | 55.3% | 3.7 |
About College Basketball Research
▶
Every number the site holds for a Division I team and the players who played for it, in one place. Pick a team and a season and read it. Nothing here needs an account.
Where the numbers come from
The same tables the boards read, resolved through one shared definition per stat. A rate is computed over the whole window rather than averaged across games, so a season figure is not the mean of the nightly ones.