Dallas Stars
New here?How to read this page
▶
How to read this page
Team tables carry the record, scoring, shooting, possession and both halves of special teams, with the league rank beside each. The record is three numbers because a club collects a standings point for losing in overtime, and the standings are ordered on points rather than wins. The roster is everyone who played for the club that season, and each line is what he did HERE rather than his whole year, so a player traded in March appears on both clubs with the games he played for each. Every rate is per sixty minutes of ice time, because a first-line forward plays twice the minutes of a fourth-line one. A dash means no number for that cell.

Dallas Stars
2022-23 · Regular Season
| Player | ||||||||||||||
|---|---|---|---|---|---|---|---|---|---|---|---|---|---|---|
 Miro HeiskanenD | 79 | 25.5 | 11 | 62 | 73 | 2 | 206 | 5.3% | 49 | 96 | 53 | 65 | 32 | 12 |
| R. SuterD | 82 | 20.4 | 3 | 22 | 25 | — | 92 | 3.3% | 81 | 115 | 23 | 45 | 26 | — |
 Esa LindellD | 82 | 19.9 | 8 | 16 | 24 | — | 116 | 6.9% | 87 | 147 | 31 | 56 | 10 | 29 |
| J. HakanpääD | 82 | 19.3 | 6 | 10 | 16 | — | 86 | 7% | 224 | 128 | 13 | 51 | 60 | 18 |
 Jason RobertsonL | 82 | 18.8 | 46 | 63 | 109 | 13 | 313 | 14.7% | 57 | 19 | 62 | 66 | 20 | 37 |
| J. PavelskiC | 82 | 17.7 | 28 | 49 | 77 | 13 | 184 | 15.2% | 93 | 64 | 32 | 57 | 8 | 42 |
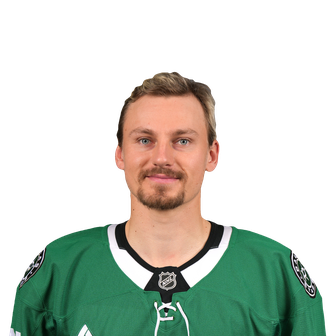 Roope HintzC | 73 | 17.6 | 37 | 38 | 75 | 9 | 184 | 20.1% | 47 | 45 | 26 | 38 | 30 | 31 |
 Thomas HarleyD | 6 | 16.8 | — | 2 | 2 | — | 8 | 0% | 1 | 8 | — | 3 | 2 | 5 |
| C. MillerD | 79 | 16.8 | 6 | 15 | 21 | 1 | 106 | 5.7% | 108 | 70 | 29 | 48 | 37 | 23 |
 Tyler SeguinC | 76 | 16.6 | 21 | 29 | 50 | 7 | 189 | 11.1% | 84 | 23 | 28 | 33 | 24 | 3 |
 Nils LundkvistD | 60 | 16.3 | 6 | 10 | 16 | 1 | 94 | 6.4% | 49 | 67 | 6 | 32 | 26 | -5 |
 Max DomiC | 20 | 16.2 | 2 | 5 | 7 | — | 36 | 5.6% | 6 | 6 | 18 | 8 | 6 | -6 |
 Jamie BennL | 82 | 15.8 | 33 | 45 | 78 | 13 | 190 | 17.4% | 97 | 38 | 55 | 48 | 34 | 23 |
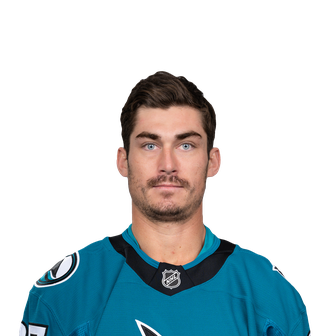 Mason MarchmentL | 68 | 15.7 | 12 | 19 | 31 | 2 | 148 | 8.1% | 88 | 39 | 38 | 41 | 80 | -6 |
 Wyatt JohnstonC | 82 | 15.5 | 24 | 17 | 41 | 3 | 160 | 15% | 22 | 31 | 47 | 55 | 20 | 6 |
| E. DadonovL | 23 | 15.1 | 3 | 12 | 15 | — | 38 | 7.9% | 14 | 10 | 6 | 7 | 2 | 2 |
 Ty DellandreaC | 82 | 14.2 | 9 | 19 | 28 | — | 92 | 9.8% | 125 | 39 | 22 | 25 | 54 | 9 |
 Radek FaksaC | 81 | 13.7 | 11 | 9 | 20 | — | 88 | 12.5% | 89 | 69 | 26 | 18 | 39 | 9 |
| J. PetersonC | 1 | 12.3 | — | — | — | — | 1 | 0% | — | 1 | — | — | — | -2 |
 Joel KivirantaL | 70 | 12.2 | 8 | 1 | 9 | — | 85 | 9.4% | 117 | 20 | 29 | 13 | 40 | -9 |
| D. GurianovR | 43 | 12.1 | 2 | 7 | 9 | — | 70 | 2.9% | 23 | 17 | 11 | 17 | 4 | -2 |
| L. GlendeningC | 70 | 12.1 | 3 | 3 | 6 | — | 65 | 4.6% | 114 | 60 | 11 | 8 | 50 | -9 |
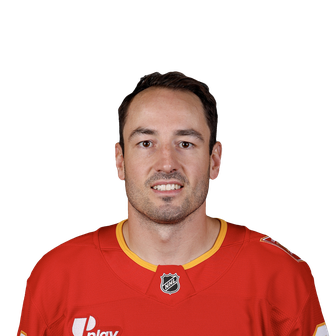 Joel HanleyD | 26 | 11.6 | — | 2 | 2 | — | 14 | 0% | 24 | 28 | 3 | 7 | 15 | 5 |
| F. OlofssonL | 28 | 10.2 | 1 | 3 | 4 | — | 34 | 2.9% | 32 | 8 | 7 | 4 | 2 | — |
| M. BlümelR | 6 | 9.7 | 1 | — | 1 | — | 7 | 14.3% | 7 | 2 | 3 | 5 | — | -2 |
| F. KarlstromC | 5 | 9.6 | — | — | — | — | 6 | 0% | 1 | 1 | 1 | 1 | — | 1 |
| M. StudenicR | 3 | 8.7 | — | — | — | — | 4 | 0% | 3 | — | — | 3 | — | -1 |
 Riley TufteL | 3 | 8.0 | — | — | — | — | 1 | 0% | 6 | — | — | — | — | -1 |
 Jake OettingerG | — | — | — | — | — | — | — | — | — | — | — | — | — | — |
 Scott WedgewoodG | — | — | — | — | — | — | — | — | — | — | — | — | — | — |
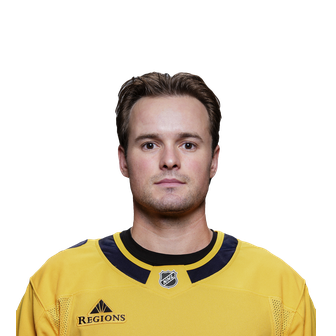 Matt MurrayG | — | — | — | — | — | — | — | — | — | — | — | — | — | — |
About NHL Research
▶
Every number the site holds for an NHL club and the players who played for it, in one place. Pick a club, a season and a set of games, and read it. Nothing here needs an account.
Where the numbers come from
The same tables the boards read, resolved through one shared definition per stat. A rate is computed over the whole window rather than averaged across games, so a season figure is not the mean of the nightly ones.