Vegas Golden Knights
New here?How to read this page
▶
How to read this page
Team tables carry the record, scoring, shooting, possession and both halves of special teams, with the league rank beside each. The record is three numbers because a club collects a standings point for losing in overtime, and the standings are ordered on points rather than wins. The roster is everyone who played for the club that season, and each line is what he did HERE rather than his whole year, so a player traded in March appears on both clubs with the games he played for each. Every rate is per sixty minutes of ice time, because a first-line forward plays twice the minutes of a fourth-line one. A dash means no number for that cell.

Vegas Golden Knights
2021-22 · Regular Season
| Player | ||||||||||||||
|---|---|---|---|---|---|---|---|---|---|---|---|---|---|---|
| A. PietrangeloD | 80 | 24.6 | 13 | 31 | 44 | 3 | 227 | 5.7% | 66 | 164 | 93 | 56 | 42 | 7 |
 Shea TheodoreD | 78 | 23.1 | 14 | 38 | 52 | 1 | 205 | 6.8% | 37 | 97 | 60 | 58 | 24 | 6 |
 Brayden McNabbD | 69 | 19.7 | 3 | 15 | 18 | — | 85 | 3.5% | 154 | 179 | 37 | 28 | 42 | 10 |
| A. MartinezD | 26 | 19.5 | 3 | 5 | 8 | — | 32 | 9.4% | 26 | 68 | 8 | 19 | 4 | 6 |
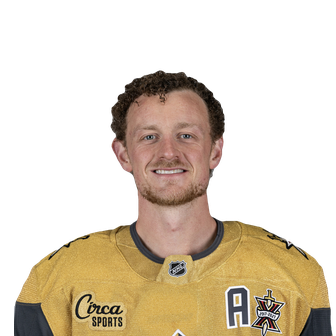 Jack EichelC | 34 | 19.4 | 14 | 11 | 25 | 3 | 133 | 10.5% | 45 | 35 | 25 | 29 | 10 | 3 |
 Chandler StephensonC | 79 | 19.3 | 21 | 43 | 64 | 6 | 125 | 16.8% | 68 | 44 | 40 | 32 | 26 | 5 |
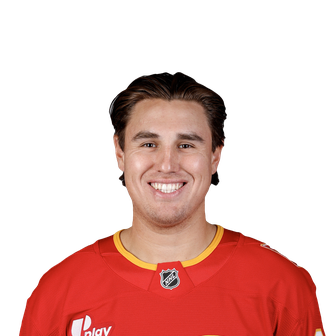 Zach WhitecloudD | 59 | 18.8 | 8 | 11 | 19 | — | 94 | 8.5% | 98 | 115 | 13 | 26 | 20 | 21 |
 Nicolas HagueD | 52 | 18.7 | 4 | 10 | 14 | — | 116 | 3.4% | 57 | 80 | 25 | 23 | 38 | 6 |
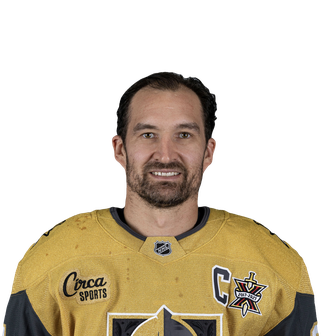 Mark StoneR | 37 | 18.3 | 9 | 21 | 30 | 3 | 71 | 12.7% | 19 | 24 | 56 | 29 | 8 | 7 |
 William KarlssonC | 67 | 18.3 | 12 | 23 | 35 | 1 | 135 | 8.9% | 42 | 42 | 44 | 34 | 10 | 3 |
| R. SmithR | 56 | 17.8 | 16 | 22 | 38 | 3 | 150 | 10.7% | 55 | 23 | 29 | 42 | 8 | 4 |
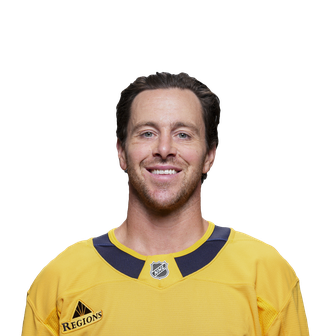 Jonathan MarchessaultR | 76 | 17.6 | 30 | 36 | 66 | 5 | 251 | 12% | 61 | 17 | 38 | 46 | 36 | 3 |
| M. PaciorettyL | 39 | 17.4 | 19 | 18 | 37 | 4 | 148 | 12.8% | 30 | 21 | 15 | 23 | 33 | 8 |
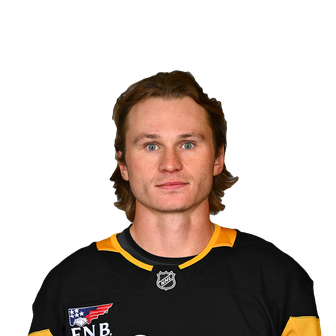 Kaedan KorczakD | 1 | 16.6 | — | — | — | — | — | — | — | 1 | — | — | — | 1 |
 Nicolas RoyC | 78 | 16.3 | 15 | 24 | 39 | 2 | 145 | 10.3% | 85 | 34 | 34 | 38 | 51 | 12 |
| E. DadonovL | 78 | 15.8 | 20 | 23 | 43 | 5 | 177 | 11.3% | 65 | 25 | 17 | 30 | 18 | 4 |
| B. HuttonD | 58 | 15.5 | 3 | 10 | 13 | — | 78 | 3.8% | 49 | 72 | 16 | 19 | 32 | 7 |
 Mattias JanmarkC | 67 | 14.3 | 9 | 16 | 25 | — | 89 | 10.1% | 19 | 28 | 29 | 19 | 21 | 3 |
 Derrick PouliotD | 2 | 14.3 | — | 1 | 1 | — | — | — | 4 | 5 | 1 | 1 | 2 | — |
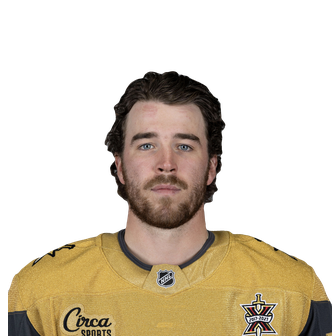 Dylan CoghlanD | 59 | 14.2 | 3 | 10 | 13 | 2 | 108 | 2.8% | 62 | 61 | 20 | 28 | 18 | -5 |
| S. BaertschiL | 1 | 13.9 | — | — | — | — | 1 | 0% | — | — | — | — | — | -1 |
 Peyton KrebsC | 9 | 13.7 | — | — | — | — | 10 | 0% | 6 | 3 | 2 | 4 | 2 | -6 |
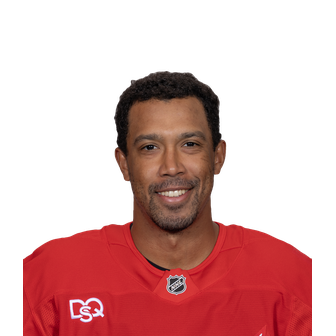 Keegan KolesarR | 77 | 12.7 | 7 | 17 | 24 | 1 | 94 | 7.4% | 246 | 46 | 33 | 36 | 68 | -6 |
 Michael AmadioR | 53 | 12.3 | 11 | 7 | 18 | — | 62 | 17.7% | 39 | 16 | 25 | 9 | 15 | — |
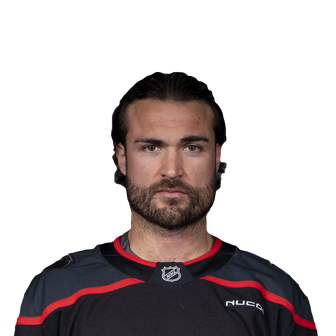 William CarrierL | 63 | 11.6 | 9 | 11 | 20 | — | 120 | 7.5% | 159 | 24 | 24 | 12 | 34 | 7 |
| N. PatrickC | 25 | 11.5 | 2 | 5 | 7 | — | 34 | 5.9% | 26 | 3 | 13 | 10 | 6 | 1 |
| J. LeschyshynC | 41 | 11.3 | 2 | 4 | 6 | — | 35 | 5.7% | 45 | 23 | 13 | 4 | 8 | -2 |
| A. BrooksC | 7 | 11.0 | 2 | — | 2 | — | 5 | 40% | 2 | 2 | 2 | 1 | 2 | 3 |
| Z. HayesD | 3 | 10.9 | — | — | — | — | 1 | 0% | 12 | 1 | — | 3 | — | -2 |
 Brett HowdenC | 47 | 10.7 | 9 | 11 | 20 | — | 39 | 23.1% | 62 | 36 | 13 | 14 | 12 | 9 |
 Jonas RondbjergR | 30 | 10.0 | 2 | 4 | 6 | — | 30 | 6.7% | 13 | 11 | 8 | 5 | 4 | — |
| D. MiromanovD | 11 | 9.8 | — | 1 | 1 | — | 15 | 0% | 5 | 6 | 1 | 2 | 2 | — |
 Brayden PachalD | 2 | 9.8 | — | — | — | — | 1 | 0% | 2 | 1 | 1 | 1 | — | -2 |
 Paul CotterL | 7 | 8.8 | 2 | — | 2 | — | 11 | 18.2% | 17 | 1 | 1 | — | 6 | 1 |
 Ben JonesC | 2 | 8.0 | — | — | — | — | 1 | 0% | 4 | 1 | — | — | 2 | — |
 Pavel DorofeyevR | 2 | 6.5 | — | — | — | — | 1 | 0% | — | 1 | 2 | — | 2 | -1 |
| R. LehnerG | — | — | — | — | — | — | — | — | — | — | — | — | — | — |
 Laurent BrossoitG | — | — | — | — | — | — | — | — | — | — | — | — | — | — |
 Logan ThompsonG | — | — | — | — | — | — | — | — | — | — | — | — | — | — |
About NHL Research
▶
Every number the site holds for an NHL club and the players who played for it, in one place. Pick a club, a season and a set of games, and read it. Nothing here needs an account.
Where the numbers come from
The same tables the boards read, resolved through one shared definition per stat. A rate is computed over the whole window rather than averaged across games, so a season figure is not the mean of the nightly ones.