Detroit Pistons
New here?How to read this page
▶
How to read this page
Team tables split by side of the ball, and the Side control hides the half you are not reading. The roster is everyone who played for the team that season, not who is on it now, so a player since traded away stays in the season he played. A dash means no number for that cell, or a zero in a roster column that counts.
Season
Team
Games
View
Scale

Detroit Pistons
2023-24 · Regular Season
Players31 of 31
| Player | |||||||||
|---|---|---|---|---|---|---|---|---|---|
 Cade CunninghamPG | 63 | 32.9 | 22.3 | 4.3 | 7.4 | 44.9% | 35.5% | 54.6% | 0.1 |
 Jaden IveySG | 77 | 28.8 | 15.4 | 3.4 | 3.8 | 42.9% | 33.6% | 53.6% | -2.9 |
 Jalen DurenC | 62 | 28.7 | 13.6 | 11.4 | 2.4 | 61.9% | 0% | 65.3% | -0.2 |
 Marcus SasserPG | 71 | 19 | 8.3 | 1.8 | 3.3 | 42.8% | 37.5% | 54.2% | -2.5 |
 Bojan BogdanovicPF | 29 | 31.8 | 19.5 | 3.2 | 2.4 | 46.8% | 41.5% | 60% | — |
 Ausar ThompsonSF | 64 | 24.7 | 8.7 | 6.3 | 1.9 | 48.3% | 18.6% | 52.2% | -2.2 |
 Alec BurksSG | 43 | 21 | 12.6 | 2.6 | 1.6 | 39.4% | 40.1% | 58.1% | — |
 Isaiah StewartC | 47 | 30.3 | 10.7 | 6.5 | 1.6 | 48.8% | 38.5% | 60.1% | -2.5 |
 James WisemanC | 63 | 17.3 | 7.1 | 5.3 | 0.9 | 61.3% | 0% | 63.7% | -3.2 |
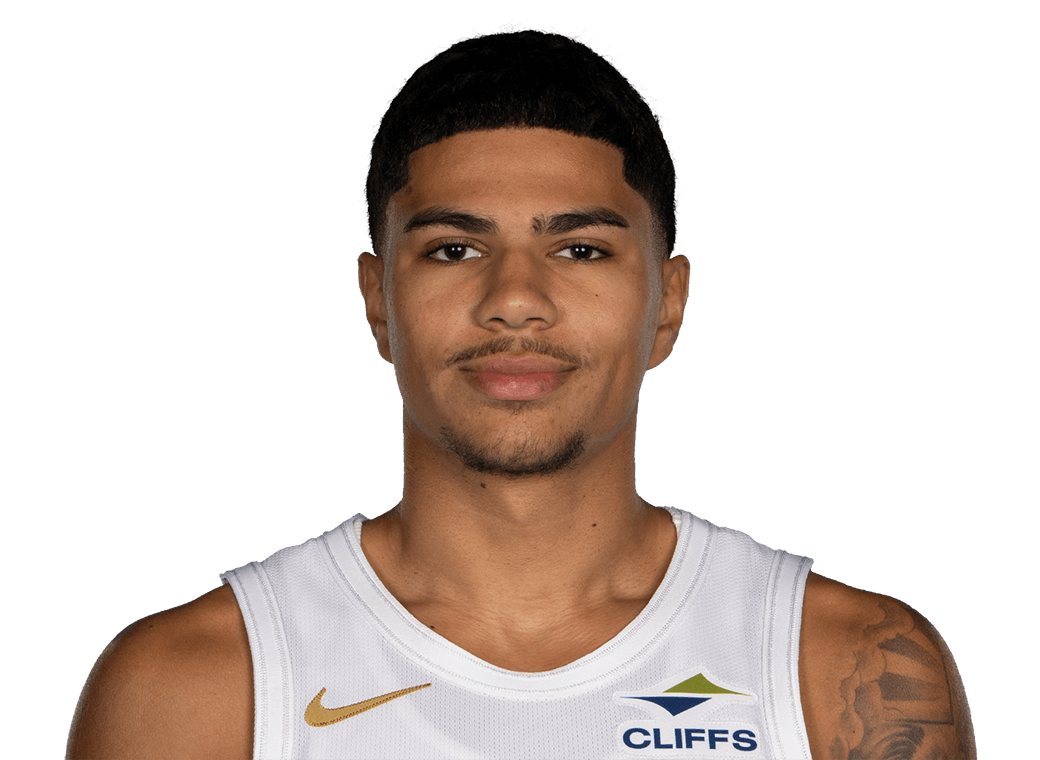 Killian HayesPG | 42 | 24 | 6.9 | 2.8 | 4.9 | 41.3% | 29.7% | 47.4% | -2.7 |
 Marvin Bagley IIIC | 26 | 18.4 | 10.2 | 4.5 | 1 | 59.1% | 16.7% | 63.8% | — |
 Simone FontecchioSF | 17 | 28.5 | 14.5 | 4.1 | 1.6 | 47.9% | 42.6% | 61.3% | — |
 Kevin Knox IISF | 31 | 18.1 | 7.2 | 2.4 | 0.7 | 46.2% | 33% | 57% | -3.8 |
 Evan FournierSG | 29 | 18.7 | 7.2 | 1.9 | 1.6 | 37.3% | 27% | 48.2% | — |
 Malachi FlynnPG | 24 | 14.3 | 8 | 1.8 | 2.1 | 43% | 31.6% | 52.8% | — |
 Chimezie MetuPF | 14 | 29.4 | 10.5 | 6 | 1.9 | 50% | 30.2% | 59.6% | — |
 Stanley UmudeSF | 25 | 12.3 | 5.1 | 2 | 0.4 | 44% | 45.3% | 64.7% | -2.2 |
 Isaiah LiversSF | 24 | 19.6 | 4.8 | 2 | 1 | 34.5% | 28.6% | 46% | -5.9 |
 Troy Brown Jr.SF | 22 | 19 | 4.2 | 3.3 | 1.1 | 29.6% | 28.1% | 40.6% | — |
 Tosan EvbuomwanPF | 13 | 22.5 | 7 | 3.5 | 0.8 | 57.1% | 41.7% | 67.9% | — |
 Jared RhodenSF | 18 | 13.6 | 4.6 | 1.8 | 0.8 | 50% | 38.7% | 59.7% | -2.1 |
 Danilo GallinariPF | 6 | 14.9 | 8.7 | 2.3 | 2 | 54.5% | 58.3% | 79.9% | — |
 Mike MuscalaC | 13 | 13.2 | 3.5 | 2.2 | 0.8 | 34.1% | 38.2% | 49.2% | — |
 Joe HarrisSF | 17 | 10 | 2.3 | 0.8 | 0.6 | 35.9% | 33.3% | 48.9% | -5.8 |
 Buddy BoeheimSG | 10 | 8.4 | 3.4 | 1 | 0.3 | 31% | 32% | 50.9% | -3.9 |
 Quentin GrimesSG | 7 | 16.5 | 4.6 | 1.7 | 2 | 21.4% | 14.3% | 34.2% | — |
 Jaylen NowellSG | 4 | 14.4 | 7.5 | 2.5 | 0.8 | 52.2% | 33.3% | 58.5% | — |
 Monte MorrisPG | 7 | 9.8 | 3.9 | 1.7 | 1.1 | 36.4% | 18.2% | 39.8% | — |
 Shake MiltonSG | 4 | 15.8 | 6.8 | 4.5 | 1.5 | 42.3% | 33.3% | 49.4% | — |
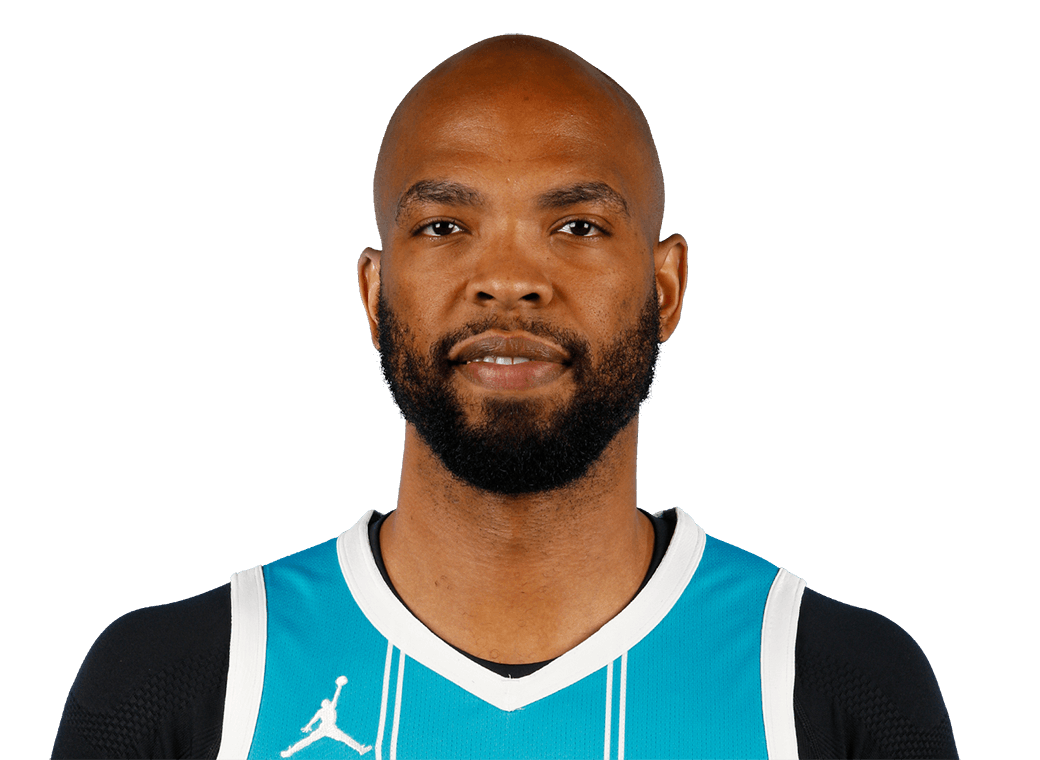 Taj GibsonPF | 5 | 7.8 | 3.6 | 1.8 | 0.4 | 57.1% | 50% | 64.3% | — |
 Malcolm CazalonSG | 2 | 1.3 | — | — | — | — | — | — | -9.1 |
About NBA Research
▶
Every number the site holds for an NBA team and the players who played for it, in one place. Pick a team, a season and a set of games, and read it. Nothing here needs an account.
Where the numbers come from
The same tables the boards read, resolved through one shared definition per stat. A rate is computed over the whole window rather than averaged across games, so a season figure is not the mean of the nightly ones.